school-bus-star

Breathe cleaner air right now.

NGVs offer the fastest, most cost-effective path to reducing heavy-duty vehicle emissions

2025

OUR GOAL

Every child in America should awake in a neighborhood with clean air by 2025.  Natural Gas Vehicles can get us there.

THE PROBLEM

Our Air - New
Image is not available

U.S. transit buses now running on CNG or LNG.

Image is not available

Airports operating NGVs in their private fleets or championing policies that encourage use by private fleets.

Image is not available

New refuse trucks running on natural gas.

Too many breathe unhealthy air daily
Image is not available

Close to 120 million people – nearly 36% of all Americans – live in places with failing grades for unhealthy levels of ozone or particle pollution. Breathing that air increases the risk of asthma, lung cancer, and heart disease.

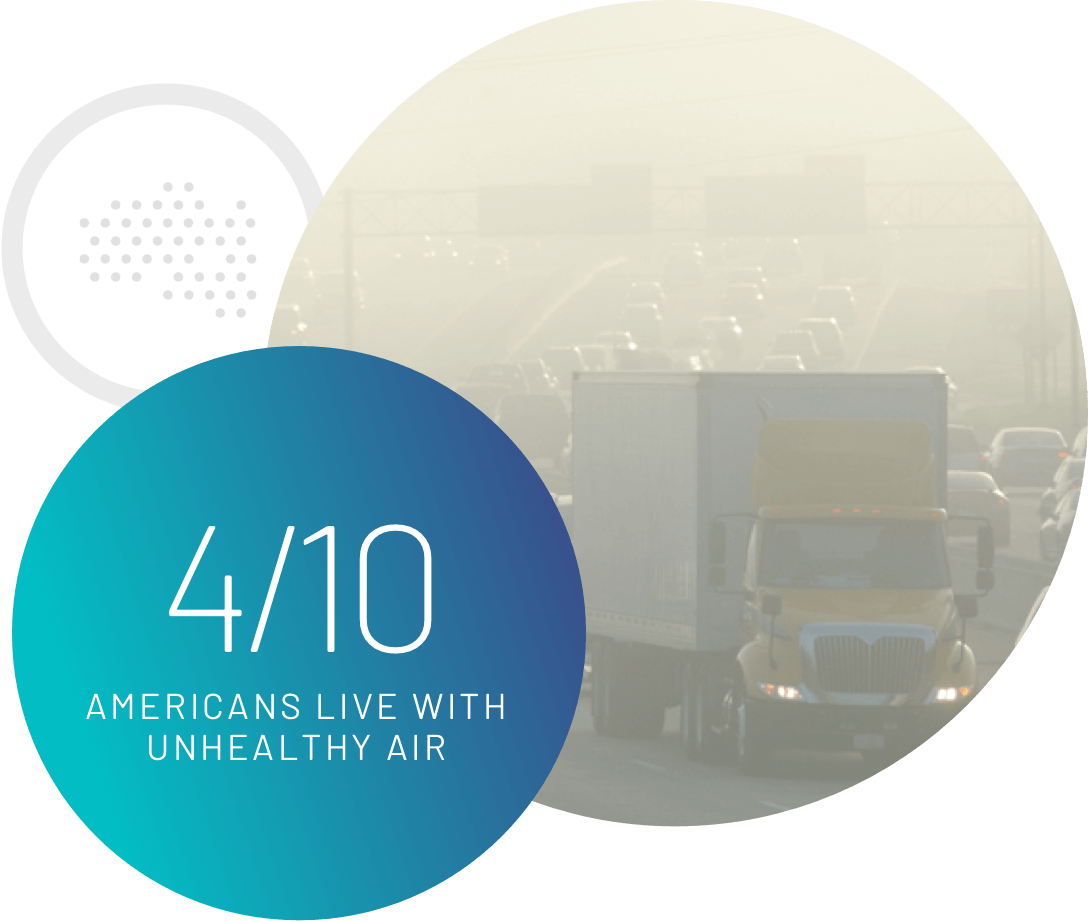
Despite decades of progress on cleaning up sources of air pollution, more than 40% of Americans—over 137 million people—are living in places with 'very unhealthy' and 'hazardous' air quality.

EPA CRITERIA POLLUTANTS

EPA CRITERIA POLLUTANTS

Carbon Monoxide (C0)

Lead (Pb)

Nitrogen Oxides (NOx)

Carbon Monoxide (C0)

Lead (Pb)

Nitrogen Oxides (NOx)

Ground-level Ozone (NOx + VOC)

Particle Pollution (Particle Matter)

Sulfur Oxides (S0)

Ground-level Ozone (NOx + VOC)

Particle Pollution (Particle Matter)

Sulfer Oxides (S0)

Source: American Lung Association, "State of the Air" 2023

Image is not available

Americans live with unhealthy air

4/10

134 million people in the United States live in counties that have unhealthy levels of either ozone or particle pollution. Breathing that air increases the risk of asthma, lung cancer and heart disease.

125 million people in the United States live in counties that have unhealthy levels of either ozone or particle pollution. Breathing that air increases the risk of Asthma, lung cancer and heart disease.

EPA CRITERIA POLLUTANTS

EPA CRITERIA POLLUTANTS

Carbon Monoxide (C0)

Lead (Pb)

Carbon Monoxide (C0)

Lead (Pb)

Nitrogen Oxides (NOx)

Ground-level Ozone (NOx + VOC)

Particle Pollution (Particle Matter)

Sulfer Oxides (S0)

Nitrogen Oxides (NOx)

Ground-level Ozone (NOx + VOC)

Particle Pollution (Particle Matter)

Sulfer Oxides (S0)

Source: American Lung Association, State of the Air 2018

Asthma Rates
Image is not available

25 million Americans (1 in 12) suffer from asthma. That's about 8% of the population.

Image is not available

In 2007, asthma cost the U.S. about $56 billion in medical costs, lost school/work days and early death.

Image is not available

In 2009, 1 in 6 African-American children had asthma, the top rate amongst all racial/ethnic groups.

Source: American Lung Association, State of the Air 2018

Asthma rates are on the rise
Residents of frontline communities are disproportionately impacted by dirty air
Image is not available

25 million Americans (1 in 12) suffer from asthma, including 5.5 million children. That’s about 8% of the population.

25 million Americans (1 in 12) suffer from asthma. That's about 8% of the population.

Image is not available

More than 18 million Americans live in counties that got an “F” for all three air pollution measures.

In 2007, asthma cost the U.S. about $56 billion in medical costs, lost school/work days and early death.

Image is not available

People of color are 3.7 times more likely than white people to live in a county with three failing air quality grades.

In 2009, 1 in 6 African-American children had asthma, the top rate amongst all racial/ethnic groups.

Source: American Lung Association, State of the Air 2023

previous arrowprevious arrow
next arrownext arrow

THE SOURCE

Heavy- and medium-duty vehicles are the No. 1 source of smog

While HDVs total 7 percent of all vehicles on America’s roadways, they account for upwards of 50 percent of all smog-precursor emissions and 20 percent of all transportation-related greenhouse gases (GHGs).

Heavy duty vehicles (HDVs) account for upwards of 50 percent of America’s smog-precursor emissions.

Source: Game Changer Technical White Paper, Gladstein, Neandross & Associates, May 2016

LEADING SOURCES OF URBAN EMISSIONS

WHAT ARE HDVs?
heavy-medium-duty-1

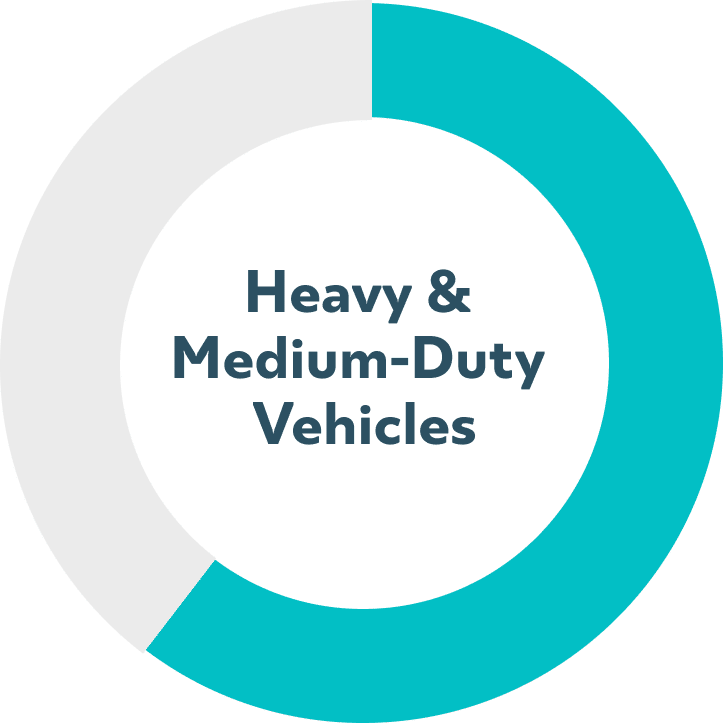
43%

Heavy-duty trucks not certified to current U.S. EPA NOx emission standard

heavy-medium-duty-1

57%

57% Heavy-duty trucks certified to current U.S. EPA NOx emission standard

Heavy-duty vehicles – the fastest growing segment of U.S. transportation in terms of energy use and emissions – include:

Short-Haul Trucks
Long-Haul Trucks
Refuse Trucks
School Buses
Transit Buses

EMISSIONS GETTING STRICTER

Natural gas engines are certified to the aggressive CARB Model Year 2024 standard without using credits.

Source: California Air Resources Board

WHAT ARE HDVs?

Heavy-duty vehicles – the fastest growing segment of U.S. transportation in terms of energy use and emissions – include: short-haul trucks, long-haul trucks, refuse trucks, school buses and transit buses.

THE SOLUTION

Replace diesel HDVs & MDVs with Natural Gas Vehicles

NGVs deliver the largest and most cost-effective NOx emissions reductions

Refuse Trucks

APPLICATION

NATURAL GAS

DIESEL

ELECTRIC

Image is not available

Refuse Trucks

Image is not available

Refuse Trucks

NATURAL GAS

$69

per lb of NOx

$300,000

Technology cost

4,375

NOx reduced

DIESEL

$496

per lb of NOx

$270,000

Technology cost

544

NOx reduced

ELECTRIC

$151

per lb of NOx

$670,000

Technology cost

4,423

NOx reduced

Source: Emission comparisons based on ANL - HDVEC tool with low-NOx engines and higher in-use diesel emissions taken into account. Useful life, cost and mileage vary by applications.

Long/Short-haul Trucks

APPLICATION

NATURAL GAS

DIESEL

ELECTRIC

Image is not available

Long/Short-haul Trucks

Image is not available

Long/Short-haul Trucks

NATURAL GAS

$27

per lb of NOx

$150,000

Technology cost

5,582

NOx reduced

DIESEL

$58

per lb of NOx

$100,000

Technology cost

1,716

NOx reduced

ELECTRIC

$51

per lb of NOx

$290,000

Technology cost

5,715

NOx reduced

Source: Emission comparisons based on ANL - HDVEC tool with low-NOx engines and higher in-use diesel emissions taken into account. Useful life, cost and mileage vary by applications.

Transit Buses

APPLICATION

NATURAL GAS

DIESEL

ELECTRIC

Image is not available

Transit Buses

Image is not available

Transit Buses

NATURAL GAS

$129

per lb of NOx

$526,500

Technology cost

4,078

NOx reduced

DIESEL

$3,559

per lb of NOx

$477,775

Technology cost

134

NOx reduced

ELECTRIC

$203

per lb of NOx

$836,330

Technology cost

4,128

NOx reduced

Source: Emission comparisons based on ANL - HDVEC tool with low-NOx engines and higher in-use diesel emissions taken into account. Useful life, cost and mileage vary by applications.

School Buses

APPLICATION

NATURAL GAS

DIESEL

ELECTRIC

Image is not available

School Buses

Image is not available

Transit Buses

NATURAL GAS

$90

per lb of NOx

$125,00

Technology cost

1,391

NOx reduced

DIESEL

$1,764

per lb of NOx

$100,000

Technology cost

57

NOx reduced

ELECTRIC

$190

per lb of NOx

$300,000

Technology cost

1,583

NOx reduced

Source: Emission comparisons based on ANL - HDVEC tool with low-NOx engines and higher in-use diesel emissions taken into account. Useful life, cost and mileage vary by applications.

previous arrowprevious arrow
next arrownext arrow

In-use testing results of heavy-duty trucks in port applications finds that diesel emits up to 5-times more NOx than certification levels. Natural gas certification levels for NOx are already 10x less than diesel

NGV emissions during deputy cycles (slower speeds, idling, stop and go traffic) decrease while diesel deputy cycle emissions increase.

FUEL

Natural Gas and Renewable Natural Gas provide CO2 and greenhouse gas emission reductions compared to diesel:

Renewable-Natural-Gas-v4

* Dependent upon RNG source. Reductions of 45% (landfill) up to 582% (dairy) compared to diesel; values based on CARB LCFS program data under CA-GREET 3.0.
CALLOUT 3

NATURAL GAS vs. ELECTRIC

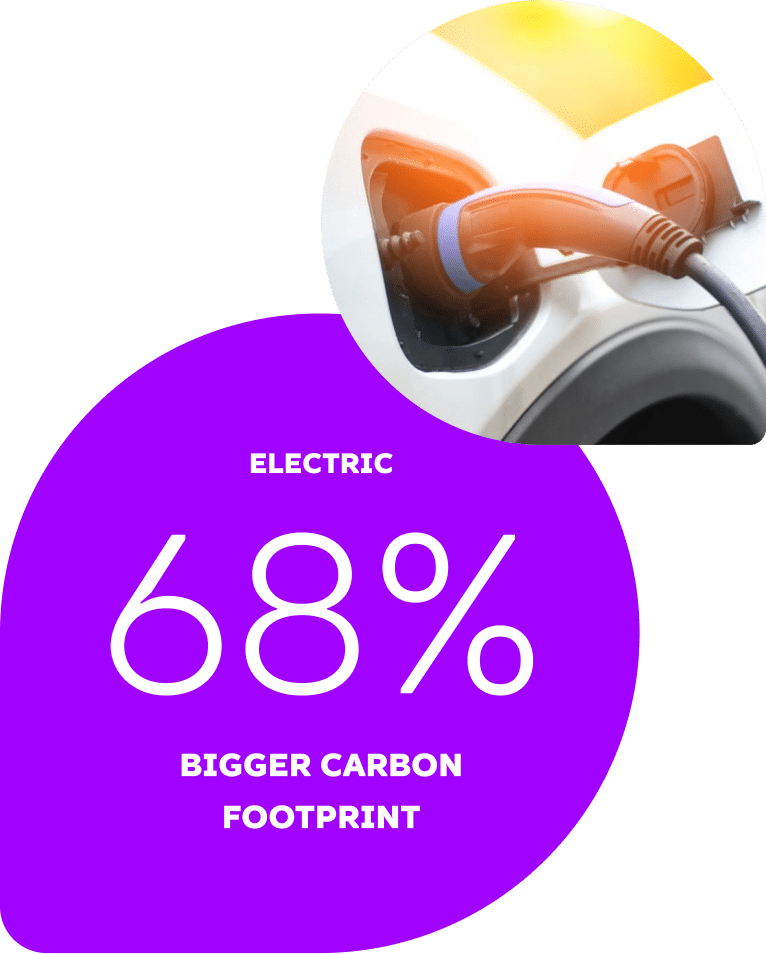
It’s more than just the tail pipe … Life-cycle emissions matter too

According to the Union of Concerned Scientists, it takes so much energy to make batteries that Electric Vehicles with a 250-mile range start out life with a carbon footprint 68% higher than a piston-engine car.